IPCC Science In Trouble: A Significant Drop In Global Temperature

According to the World Meteorological Organization (WMO), three of the hottest years in measurement history (note! not the warmest) have been 2016, 2019, and 2020 (see Figure 1 below).
The total radiative forcings (RF) according to the IPCC reports and the temperature changes calculated from them have also been added to Figure 1, according to the IPCC’s simple climate model.
These values show that only the temperature measured in 2005 and the model-calculated values have been more or less the same (adjusted by aerosol/cloud forcings).

Figure 1. Temperature development between 1980 and 2020, IPCC temperature forcings, and the temperature values calculated from them.
This value is embarrassing for the IPCC that the total climate forcings were lower than in 2000, even though greenhouse gas concentrations had risen by 2005.
According to the latest assessment report AR5 of IPCC, the temperature increase from 1880 to 2011 had been 0.85°C and the IPCC climate forcings give a value of 1.17°C, so there was an error of 0.32°C (38%).
This is probably the reason why there are no model-calculated temperature values for 2011 in the AR5, but plenty of future forecasts.
Therefore, this is a conclusion: The IPCC models calculate future temperatures accurately, but they are not suitable for calculating current temperatures from 1750 or from 1880 onward.
The new IPCC report, AR6, will be published in April 2021. Since it takes a couple of years to make a report, the latest data, which can still be used in the calculations are the years 2019 and 2020.
Both years have been looking very good for the IPCC because the measured and calculated temperatures are finally very close to each other.
Some dark clouds have been recently appeared on the horizon, which can be observed in Figure 2.

Figure 2. Monthly values of the satellite temperature UAH and Gistemp measurement series between 2006 and 2020. Gistemp has increased by about 0.2 °C more during the period than UAH. Temperature series have a different standardization method. The impact of ENSO events has been calculated using the formula 0.1*ONI (Oceanic Nino Index) applying a delay of five months.
Since October 2010, the temperature has dropped from 0.4°C in November to 0.15°C in December, to 0.12°C in January, and to 0.2°C in February.
Temperature changes since 2014 can be assessed against the background information that carbon dioxide (CO2) concentrations have increased from 398.87 ppm in 2014 to 414.24 ppm in 2020.
According to IPCC science, this change causes a temperature change of 0.1°C meaning 0.02°C per year. After 2014, the culprit for drastic temperature changes cannot be CO2 or man, even according to IPCC science, although the media writes this.
The strong temperature increase of about 0.6°C caused by the 2015-16 super El Nino is well known, but there is an understandable desire to keep quiet about it in this context, as the general public is unaware of this. The temperature effects of ENSO events are shown in Figure 2 as a blue curve.
Until 2014, ENSO events explain quite well the changes in temperature, but since then the temperature has been high in 2019-2020, even though El Ninos have been small in size.
For the high temperatures in 2019 and 2020, I have not seen research results or blog posts, with exceptions of references 1 and 2. Figure 3 shows the main cause of this warming.
Mother Nature has quietly arranged an easy-to-measure experiment, which has been kept in silence both by the climate establishment and by dissidents.
It is not a change in solar activity, and therefore I call it short-wave radiation, which has grown sharply especially since 2014. A probable reason is a change of low-level clouds, Ref. 1.

Figure 3. Annual trends in shortwave radiation from 2001 to 2020.
The radiation level in 2001 is clearly lower than in the later years. The trend in 2020 initially followed the 2019 curve closely, but then there was a change after September. Global temperatures fell sharply in December 2020 and have remained at a lower level so far.
The change in shortwave radiative forcing (RF) is significant. According to the IPCC science, the temperature effect of a change in RF at the top of the atmosphere is calculated by multiplying the RF value by the climate sensitivity parameter λ.
According to the IPCC, the value of the λ is 0,5 K/(Wm-2). This value means the positive feedback of water, which doubles the value of all other RFs.
According to my own research, there is no positive feedback in the atmosphere except the case of ENSO phenomena and therefore the value of λ is 0,27 K/(Wm-2).
So, a change in RF of 1 Wm-2 causes a temperature change of approximately 0,3°C, Ref. 3. The large model-calculated temperature differences in Figures 4 and 5 are due to the different λ values.

Figure 4. Temperature trend and Ollila model.
Figure 4 shows that my model explains very well the temperature changes. If you’re wondering why the last value of shortwave radiation in this presentation is from May 2020, the explanation is that NASA updates new versions for CERES satellites every 2-3 months, and now the last monthly value is from October 2020.
Since CERES values include seasonal variation, they must be averaged using the 12-month method, i.e. monthly values must be available 6 months backward and 6 months forward.
The IPCC has three reasons to be silent about the recent temperature trend changes. Firstly, the change in the level of shortwave radiation between 2001 and 2020 was 1.75 Wm-2, which corresponds to a temperature change of 0.88°C.
This value can be compared with the IPCC’s RF value of CO2, which was according to AR5 1.68 Wm2 from 1750 to 2011. The IPCC’s policy is that only humans should be blamed.
Secondly, the causes of climate change are man-made, and if the rise of temperature seems to be in line with the IPCC model, it is of course a good thing for the IPCC.
Thirdly, the IPCC’s simple model gives a rise in temperature after 2014, which is about 0.5 °C higher than the measured GISTEMP temperature, Figure 5.
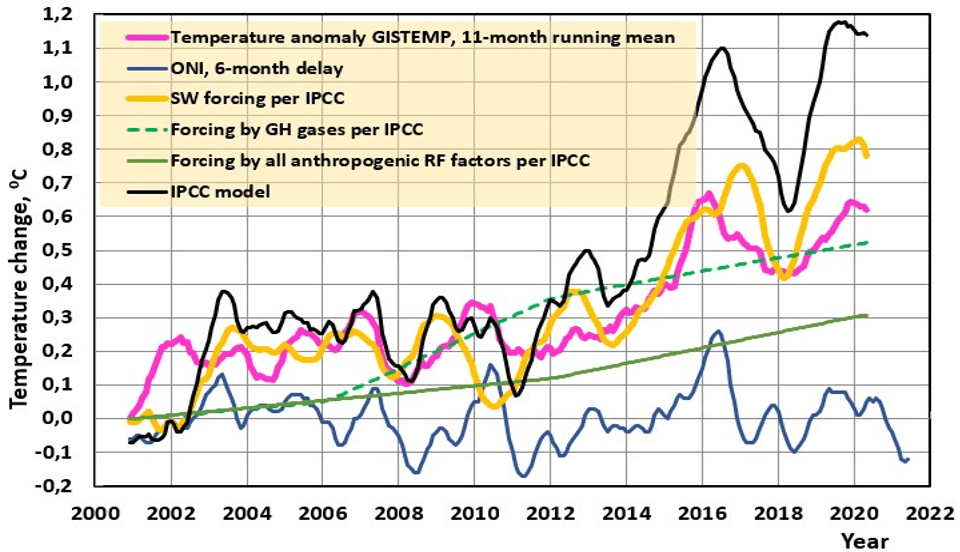
Figure 5. GISTEMP temperature trend and IPCC simple climate model.
Here too, the climate establishment has followed Wittgenstein’s instruction that “whereof we cannot speak, thereof we must remain silent.”
We have no way of knowing whether the change in shortwave radiation will be short-lived, such as the 2017-18 drop, or whether the decrease in the anomaly will continue permanently.
The experiment, organized by Mother Nature, already shows beyond doubt: there is no positive feedback of water in the atmosphere.
This experiment has already revealed that the IPCC models are not working, because they run too hot. The release of the IPCC assessment report AR6 in April 2021 will have a poor starting point because the IPCC climate science does not reflect reality.
On the other hand, the journalists have so poor know-how in climate science that the IPCC’s explanations may pass through the media without question, especially since contrarian scientists will have no opportunity to make any criticisms.
Read more here:- climatechangedispatch.com
Please Donate Below To Support Our Ongoing Work To Defend The Scientific Method
PRINCIPIA SCIENTIFIC INTERNATIONAL, legally registered in the UK as a company ![]() incorporated for charitable purposes. Head Office: 27 Old Gloucester Street, London WC1N 3AX.
incorporated for charitable purposes. Head Office: 27 Old Gloucester Street, London WC1N 3AX.
Trackback from your site.
Brian James
| #
Mar 8, 2021 Dozens Of Credible Atmospheric Scientists
https://youtu.be/TbE0DFVAX8M
Reply