Fraud: How the CDC Turns Flu & Pneumonia into COVID-19

In part 1 of this 5-part report on Covid-19, Corey’s Digs detailed a necessary reality check due to the media creating a frenzy over hospitalizations, despite the fact that the 2017-2018 flu season was hit with 810,000 hospitalizations, far more than Covid, and no one heard a peep about it.
There were no lockdowns, restrictions, hyperbole, or mandatory masks, and 61,000 people died that season.
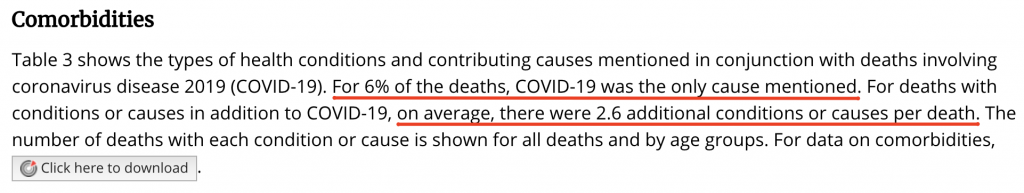
Most people aren’t aware that the CDC has lumped influenza together with Covid and pneumonia in death rates with a new name called “PIC.” This comes after the CDC confirmed that only 6% of Covid-related death certificates indicate Covid as the only cause, while 94% list other illnesses as the cause with an average of 2.6 comorbidities.
In other words, if someone was in the hospital dying of heart disease and they tested everyone for Covid to separate them to other rooms or wings, Covid was marked on their death certificate. A perfect example of this is a nurse Corey’s Digs recently spoke with who had four deaths at her hospital.
Two were in hospice care, one died of stage four cancer, and the other died of end stage COPD, but all four were documented as having Covid, so those deaths get added to the tallies being told to the public, who are none the wiser. What does that do to the actual statistics?
“PIC” – Hiding The Data
One of the most incredible things happening right before everyone’s eyes, is the subversion of data by the Covid Tracking Project, the CDC, Johns Hopkins, legacy news media, and numerous other sources. This is sheer tricky, and a far cry from “science.”
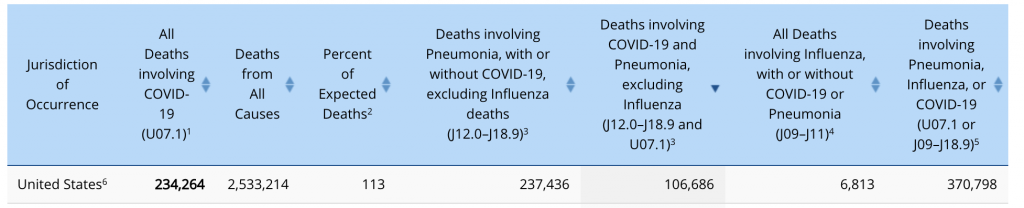
This is the standard chart header on the CDC’s weekly report updates by week and state. They refuse to show a column strictly for Covid deaths only. Why? Is it because the CDC states that only 6% of all death certificates indicate that Covid was the only cause of death? If that were the case, that would reduce this chart’s death toll to only 14,055 people.
One can take their “deaths involving Covid-19 and pneumonia” and deduce that 45.54% of all Covid-related deaths included pneumonia, but they won’t separate that out. They even reflect a number of 6,813 for influenza deaths, but say “with OR without Covid-19 or pneumonia.” As a side note, that count is substantially low for flu deaths. Notice they did the same for the first pneumonia column as well, stating “with OR without Covid-19.”
They have those hard numbers, so why won’t they let the public see them? They like to refer to this trickery as “PIC,” their new method for counting Covid deaths by lumping them in with pneumonia and influenza. Not only that, but the number of life-threatening conditions people died from, who happen to test positive for Covid, are staggering.
They are basing lockdowns, restrictions, mask mandates, and crushing the economy on COVID deaths, but refuse to reflect COVID ONLY deaths.
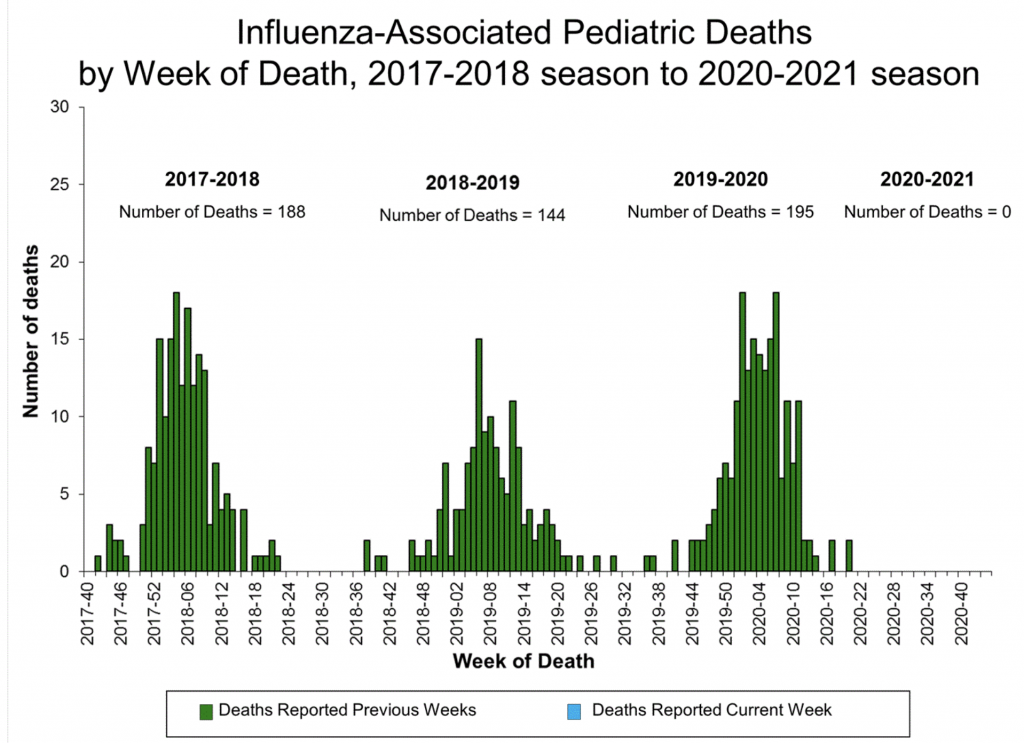
In fact, due to Covid-19, the CDC decided to totally suspend data collection for the 2020-2021 influenza season for the geographic spread of influenza. This annual interactive map goes back to 2003, but they put a halt to it in May 2020.

They are also alleging that 133 children have died in the U.S. from Covid-19, yet we would have no way of knowing if this is the case since they are lumping deaths in with influenza and pneumonia, as well as other comorbidities. During the 2019-2020 influenza season there were 195 pediatric deaths due to influenza.
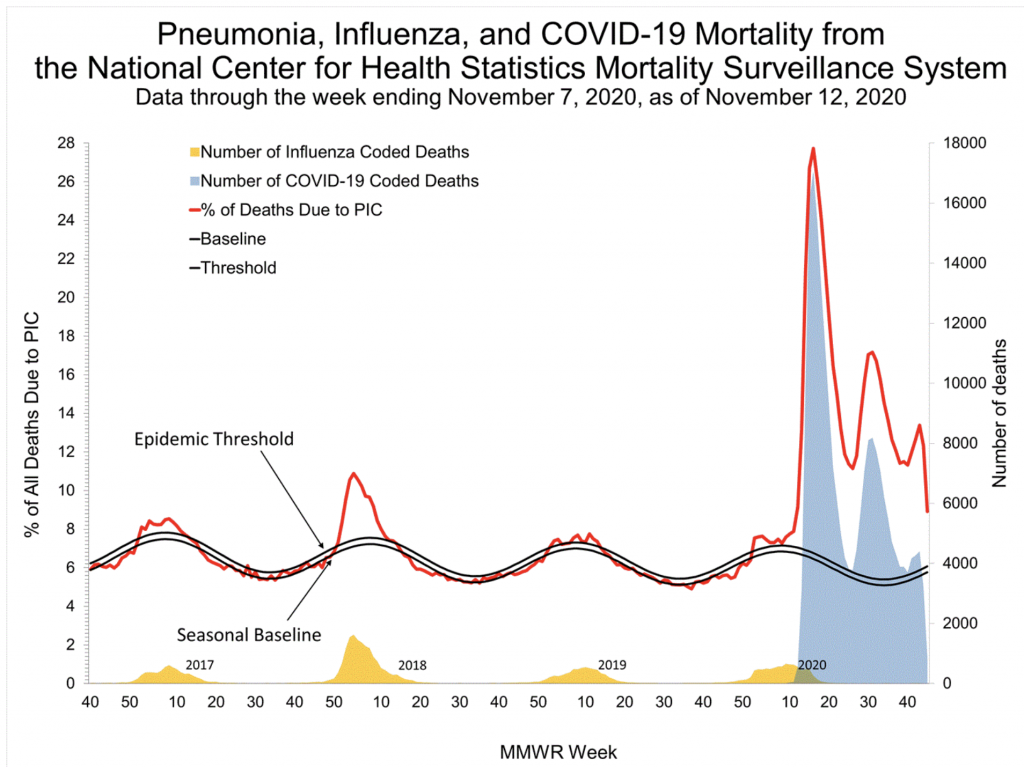
Here is another example of a very misleading chart. They use the term “Covid-19 coded deaths” when in fact only 6% are allegedly caused solely from Covid, according to the CDC, while 94% have on average 2.6 comorbidities and are documented as the cause on death certificates.
Therefore, only those documented as Covid being the cause of death should be reflected in blue. They then lump influenza, Covid, and pneumonia together as “PIC” to show the highest marker on the chart, in red. We already know that influenza is a common cause of pneumonia, and that pneumonia is documented in over 45% of Covid-related deaths.
Recap
• The Covid Tracking Project alleges nearly 256,000 people have died from Covid as of November 27, while Johns Hopkins and google reflect nearly 266,000. That in itself is quite a discrepancy.
• As noted in Corey’s Digs Hospitalizations article, the Covid Tracking Project has officially hidden the cumulative hospitalizations (because it doesn’t hold water), as well as the recovery column (because it’s good news) from their website, and can only be viewed by downloading the data via csv file
• The CDC has stated that only 6% of death certificates indicated Covid-19 as the only cause
• They are lumping Covid-related deaths in with influenza and pneumonia as “PIC”
• 94% of Covid-related deaths have on average 2.6 comorbidities, with 40% of all deaths taking place in nursing homes, long-term care facilities, and hospice
• Only 6.6% of those who get tested, are testing positive, and of those 90% are asymptomatic, while multiple studies have shown tests pumping out false/positives
• The media has created a frenzy over hospitalizations, which are far less than the 810,000 cases during the 2017-2018 influenza season, and there are currently an alleged 91,635 Covid-related hospitalizations across the entire U.S. as of November 28
• Those already dying from life-threatening illnesses, who happen to test positive for Covid, are being added to the Covid-19 death totals, despite the fact that 90% of them show no symptoms
• Original models suggested 1-2 million people would die in the U.S. alone from Covid. They allege 256,000 have, with 94% having comorbidities. To put this in perspective, over 600,000 people died of cancer last year, 655,000 people die each year from heart disease, and between 250,000 – 440,000 people die each year from medial errors
• They allege that masks work, yet after 8 months of wearing them they allege people are dying
• They closed down the economy, people lost their businesses, millions of people are waiting in food lines each week, the suicide rate has drastically climbed, elective surgeries and other life-threatening diseases were all put on hold and caused deaths, and masks are mandatory in many places causing infections and other serious issues – all totally unwarranted and unconstitutional
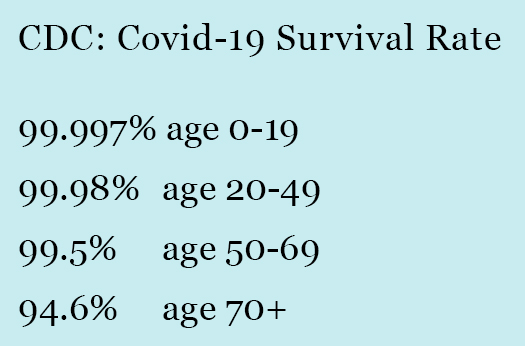
And yet, despite all of this manipulation, the fact of the matter is, the survival rate would only go up from what is already incredibly high.
We now know the numbers are being hidden and manipulated. They are also trying to create mass panic over hospitalizations that don’t even compare to the hospitalizations witnessed in the 2017-2018 flu season.
Part 3 of this 5-part report will cover the data behind nursing homes, hospice, and long-term care facilities. It is a tragedy what they are putting the elderly and their families through during this time.
Read more at www.coreysdigs.com
Please Donate Below To Support Our Ongoing Work To Expose The Lies About COVID19
PRINCIPIA SCIENTIFIC INTERNATIONAL, legally registered in the UK as a company ![]() incorporated for charitable purposes. Head Office: 27 Old Gloucester Street, London WC1N 3AX.
incorporated for charitable purposes. Head Office: 27 Old Gloucester Street, London WC1N 3AX.
Please DONATE TODAY To Help Our Non-Profit Mission To Defend The Scientific Method
Trackback from your site.
judy Ryan
| #
We need some references for these statements.
Reply
Gibs
| #
Why dont you make your own research? Sheep!
Reply
Gibs
| #
Why dont you make your own research? Sheep!
Reply
Gibs
| #
Why dont you make your own research? Sheep!
Reply
Rebecca Guirre
| #
I thank you for doing the research and asking questions the rest of us are afraid to ask. We know the panic is bring created intentionally;We know the data is being manipulated deliberately to create this sense of panic. But many of us are afraid to look deeper. So thank you for looking deeper for those who are too fearful to ask questions..
Reply
laffingdukk
| #
@Rebecca Guirre:
As an interested person who does my own research every single day, I can’t relate to your question: What are you and others afraid to ask? and What are you afraid will happen if you look yourself?
I am honestly not criticizing this…because at least you are here trying to learn, and expressing your true feelings of fear. I”m just trying to understand it because a. the majority are not like me, and I’d like to hear the answer because I can’t imagine what it could be. thanks i hope you see this, if you don’t then maybe other people can respond
Reply