RainCube, due to fly in 2017, forced JPL’s engineers to get creative in order to squeeze an antenna into a CubeSat.
Credits: Tyvak/Jonathan Sauder/NASA/JPL-Caltech.
Black magic. That’s what radiofrequency engineers call the mysterious forces guiding communications over the air. These forces involve complex physics and are difficult enough to master on Earth. They only get more baffling when you’re beaming signals into space.
Until now, the shape of choice for casting this “magic” has been the parabolic dish. The bigger the antenna dish, the better it is at “catching” or transmitting signals from far away.
But CubeSats are changing that. These spacecraft are meant to be light, cheap and extremely small: most aren’t much bigger than a cereal box. Suddenly, antenna designers have to pack their “black magic” into a device where there’s no room for a dish — let alone much else.
“It’s like pulling a rabbit out of a hat,” said Nacer Chahat, a specialist in antenna design at NASA’s Jet Propulsion Laboratory, Pasadena, California. “Shrinking the size of the radar is a challenge for NASA. As space engineers, we usually have lots of volume, so building antennas packed into a small volume isn’t something we’re trained to do.”
Neither do I! It is a man-made belief, it is a man-made money making idea, and it is a totally man-made theory, which has nothing whatsoever to do with either science or religion. There is no proof whatsoever that the evolution of the climates on this Earth has anything to do with man. Sure there is a supposition, sure there is an hysterical belief that man is changing the ‘climate’ – but which climate are the apparatchiks referring to? There is not one climate on the Earth, but 29 major systems and a million microclimates.
For years alarmists have campaigned using junk science to introduce draconian measures based on a ‘belief’ that so-called Greenhouse Gases are causing Global Warming. But there is not one shred of empirical evidence to support such a belief. But there is plenty of evidence that some profited hugely from this belief.
Below are two graphs that demonstrate why the “greenhouse effect” hypothesis is false.
This graph was created using raw weather balloon data on a day when the ground level humidity called the “mixing ratio” in Las Vegas was about 1 g/kg and the ground level “mixing ratio” in Little Rock was about 16 g/kg.
Little Rock ground level water vapor concentration = 16,000 ppm
Las Vegas ground level water vapor concentration = 1,000 ppm
Carbon Dioxide concentration = 400 ppm
The blue line is the water vapor concentration above Little Rock from ground level to ~30km in altitude.
The red line is the water vapor concentration above Las Vegas from ground level to ~30km in altitude.
The yellow line is the concentration of carbon dioxide in the atmosphere.
President-elect Donald Trump has made it clear that he regards man-made global warming as “a hoax.” Climate scientists worldwide are greatly concerned that Trump’s presidency could unravel 30 years of UN climate change work.
Trump has already appointed Myron Ebell of the Competitive Enterprise Institute to oversee the dismantling of the U.S. Environmental Protection Agency (EPA). Ebell is expected to root out corrupt practice allegedly centered around a core of “elite” government researchers involved in an international conspiracy of climate data mishandling. The allegations erupted after more than 30,000 leaked (or hacked) emails hit the worldwide web during the Climategate scandal (2009). Skeptics claim evidence in the emails exposed unethical practice by scientists at NASA, NOAA and other government departments in the U.S. linked with those in the UK Australia and New Zealand. Half a dozen self-serving official “investigations” determined there was no wrongdoing (think: Hillary Clinton’s latest email scandal).
On Twitter, Trump has called the science of global warming everything from a “hoax” to “bulls—” to a scheme “created by and for the Chinese in order to make U.S. manufacturing non-competitive.” (He later said he was joking about the China tweet).
Models and experts of every type have had plenty of setbacks making forecasts for chaotic systems. Recent examples include the election results and Nobel laureate Paul Krugman’s prediction that the US market would dive in response to the election of Trump (it in fact went on and set a new all-time record high).
If anything has lost its worth, it’s the value of Krugman’s Nobel Prize. Recently German weather site Wetterfrosch posted at Facebook that the US NOAA had been forced to correct its previous Europe seasonal forecast for the coming winter.
Earlier the NOAA had forecast a mild winter, but now the American meteorologists are foreseeing a “significantly much colder than normal month for Scandinavia and Russia“.
Sunburn and those resultant blisters are caused by ultraviolet rays radiated from the Sun. A fact known and accepted by scientists and the general public for decades. We also use the resistance of electric energy to create the heat of electric stoves and the light of incandescent light bulbs.
So it is entirely feasible for the Sun to radiate other wavelengths of the electromagnetic spectrum below the wavelength of visible light to create the heat and light wherever it encounters the resistance of another magnetic field.
This concept is the only possible way many of the bizarre temperature differentials in the solar system can be explained within the parameters of the Laws of Thermodynamics and the Laws of Physics and in conformance with the germination and enhancement of living vegetation.
NASA and federal emergency responders ran simulations on how to deal with a “city-killer” asteroid coming close to hitting the planet.
Officials simulated what to do if a “city-killer” asteroid with a 2 percent probability of impact neared the Earth on Sept. 20, 2020. As the asteroid got closer, the simulated odds of an impact ultimately increased to 100 percent, with the strike likely to crash into Southern California.
The simulated asteroid was around 800 feet in diameter, with a possibility of making impact anywhere along a long swath of Earth, including the U.S. Such an asteroid could strike with a force about 55 times stronger than the atomic bomb that destroyed Hiroshima near the end of World War II. That’s more than enough force to level a city.
Since its inception Principia Scientific International (PSI) has published many articles attempting to discredit, if not refute, the hypothesis termed the greenhouse effect of certain atmospheric gases (GHE). Recently there has been a fury (too many to cite) of articles which seem to be getting closer to accomplishing this feat. However, most all these articles are based upon reasoned arguments. I do not consider the Science founded by Galileo and Newton to have be based upon reasoned argument. The science founded by Galileo and Newton is based upon scientific laws.
What is a scientific law? First, before defining a scientific law, it seems useful, no necessary, to consider a bit of confusion which seems to exist as to what Science is, or does. This confusion possibly exists because Galileo, Newton, and their commentaries were better known to be natural philosophers instead of simply as being scientists.
The Internet of Things, activated through apps, promises tremendous convenience to homeowners. But it may also prove irresistible to hackers. [Photo Credit: Carlos Gonzalez for The New York Times]
SAN FRANCISCO — The so-called Internet of Things, its proponents argue, offers many benefits: energy efficiency, technology so convenient it can anticipate what you want, even reduced congestion on the roads.
Now here’s the bad news: Putting a bunch of wirelessly connected devices in one area could prove irresistible to hackers. And it could allow them to spread malicious code through the air, like a flu virus on an airplane.
Researchers report in a paper to be made public on Thursday that they have uncovered a flaw in a wireless technology that is often included in smart home devices like lights, switches, locks, thermostats and many of the components of the much-ballyhooed “smart home” of the future.
The researchers focused on the Philips Hue smart light bulb and found that the wireless flaw could allow hackers to take control of the light bulbs, according to researchers at the Weizmann Institute of Science near Tel Aviv and Dalhousie University in Halifax, Canada.
That may not sound like a big deal. But imagine thousands or even hundreds of thousands of internet-connected devices in close proximity. Malware created by hackers could be spread like a pathogen among the devices by compromising just one of them.
And they wouldn’t have to have direct access to the devices to infect them: The researchers were able to spread infection in a network inside a building by driving a car 229 feet away.
Just two weeks ago, hackers briefly denied access to whole chunks of the internet by creating a flood of traffic that overwhelmed the servers of a New Hampshire company called Dyn, which helps manage key components of the internet.
Security experts say they believe the hackers found the horsepower necessary for their attack by taking control of a range of internet-connected devices, but the hackers did not use the method detailed in the report being made public Thursday. One Chinese wireless camera manufacturer said weak passwords on some of its products were partly to blame for the attack.
Though it was not the first time hackers used the Internet of Things to power an attack, the scale of the effort against Dyn was a revelation to people who didn’t realize that having internet-connected things knitted into daily life would come with new risks.
“Even the best internet defense technologies would not stop such an attack,” said Adi Shamir, a widely respected cryptographer who helped pioneer modern encryption methods and is one of the authors of the report.
The new risk comes from a little-known radio protocol called ZigBee. Created in the 1990s, ZigBee is a wireless standard widely used in home consumer devices. While it is supposed to be secure, it hasn’t been held up to the scrutiny of other security methods used around the internet.
The greatest validation of scientific contribution is a peer-reviewed academic publication. But the face of academic publishing is changing as traditional journal publishers have come under attack from proponents of open access, which could change the mode of knowledge distribution in the sciences as we know it.
In selective traditional journals, editors and reviewers not only scrutinize a submission for whether the authors’ conclusions are valid, but also whether the work will generate buzz within the field. If the findings are deemed sound and significant, the paper is accepted for publication, typically after edits. At this point, the authors pay a publishing fee based on price models that usually resemble magazine advertising.
In virtually any college, you’ll find the departments that represent the trinity of the basic sciences: biology, chemistry, and physics. The fact that these departments are their own separate entities may reinforce the illusion that the subjects taught are distinct from one another. In reality, it’s difficult to impose rigorous boundaries between these disciplines. Scientific knowledge flows back and forth between seemingly distinct disciplines. Even among scientists and engineers, these delineations are constantly revised, deconstructed or reinforced.
I am currently a second-year medical student. In retrospect, one of the most challenging (but rewarding) aspect about being a pre-med was completing my pre-medical course requirements across a number of different disciplines. In retrospect, these weren’t just classes to weed out physician-hopefuls; the concepts I learned were important to elucidate the pathophysiology of many diseases. Chemistry taught me how to understand the reactions in organic chemistry, which allowed me to understand the processes of protein interactions in biochemistry, which helped me piece together the mechanisms of molecular diseases. By becoming familiar with the basics of a broad array of scientific disciplines, I was free to mix and match these concepts as needed in determining why a patient was so sick.
One of my personal idols, chemist Paul Lauterbur, famously said that all science is interdisciplinary. To prove his point, he underscored in his 2003 Nobel Laureate lecture that he, though a chemist, would be sharing the prize for physiology or medicine with a physicist. In his words, the formal categorization of scientific knowledge exists for administrative and didactic convenience rather than ontological reality.
In fact, this interdisciplinary nature can be observed in Lauterbur’s scientific contributions, which made the development of magnetic resonance imaging possible. He combined concepts from different fields to create a successful, novel technology.
Lauterbur’s career trajectory itself highlights the importance of an interdisciplinary approach to science. Lauterbur was observing a mouse tissue sampling study via NMR in a biology lab when he first devised the idea of imaging with NMR. He then consulted with local mathematicians to see whether his theories were feasible, and they validated his ideas. To test whether his theory could be realized through radiofrequency coils, he consulted a physics textbook, “The Principles of Nuclear Magnetism,” by Anatole Abragam. With this, he completed a series of experiments that confirmed his ideas. Lauterbur succeeded because he did not strictly categorize his work and was comfortable using ideas from other fields.
Following the publication of his work in Nature, Lauterbur invited several scientists from multiple disciplines to share data and collaborate on projects. Lauterbur could slip between chemistry, biology, mathematics and physics and combine many ideas from these fields. He could then encourage collaboration among various scientists and caught the attention of businesses to develop machines with tremendous applications in medicine. And while many approached him after his success to say that they or their mentors had come up with similar ideas in the past, Lauterbur distinguished himself from the rest by actually realizing his idea — thanks to this revolutionary mindset.
Many upper-level science courses, particularly in a field as broad as biology, require extensive knowledge of other disciplines. Fortunately, many university departments offer a number of opportunities that encourage cross-disciplinary thinking and application. In addition, many new exciting applications in the sciences are already creating interdisciplinary collaborations. All science majors should seek instruction outside of their own immediate majors to become more capable of linking seemingly disparate ideas together. By doing so, an interdisciplinary scientific education leads to innovation and success.
Yoo Jung is a medical student at Stanford University. She is a recent graduate of Dartmouth College and a co-author of the book, “What Every Science Student Should Know,” a guide for college students interested in majoring in STEM (University of Chicago Press). You can find her on Twitter @YooJKim and on her website at yoojkim.com.
Scientific literacy – what it is, how to recognize it, and how to help people achieve it through educational efforts, remains a difficult topic. The latest attempt to inform the conversation is a recent National Academy report “Science Literacy: concepts, contexts, and consequences” (https://www.nap.edu/download/23595).
While there is lots of substance to take away from the report, three quotes seem particularly telling to me. The first is from Roberts [1] that points out that scientific literacy has “become an umbrella concept with a sufficiently broad, composite meaning that it meant both everything, and nothing specific, about science education and the competency it sought to describe.”
The second quote, from the report’s authors, is that “In the field of education, at least, the lack of consensus surrounding science literacy has not stopped it from occupying a prominent place in policy discourse” (p. 2.6). And finally, “the data suggested almost no relationship between general science knowledge and attitudes about genetically modified food, a potentially negative relationship between biology-specific knowledge and attitudes about genetically modified food, and a small, but negative relationship between that same general science knowledge measure and attitudes toward environmental science” (p. 5.4).
“Flat Earth” The Flammarion engraving (1888) Wikipedia
Recognizing the scientifically illiterate
So, perhaps it would be useful to consider the question of scientific literacy from a different perspective, namely, how can we recognize a scientifically illiterate person from what they write or say? What clues imply illiteracy?[1]
To start, let us consider the somewhat simpler situation of standard literacy. Assume we ask a person a question and that the question is clearly composed, we might expect the illiterate person to have trouble correctly interpreting what a reasonable answer should contain. Constructing a literate answer implies two distinct abilities: the respondent needs to be able to accurately interpret what the question asks and they need to recognize what an adequate answer contains.
These are not innate skills; students need feedback and practice in both, particularly when the question is a scientific one. In my own experience with teaching, as well as data collected in the context of an introductory course [2], all to often a student’s answers consist of a single technical term, spoken (or written) as if a word = an argument or explanation.
We need a more detailed response in order to accurately judge whether an answer addresses what the question asks (whether it is relevant) and whether it has a logical coherence and empirical foundations, information that is traditionally obtained through a Socratic interrogation.[2] At the same time, an answer’s relevance and coherence serve as a proxy for whether the respondent understood (accurately interprets) what was being asked of them.
So what is added when we move to scientific in contrast to standard literacy, what is missing from the illiterate response. At the simplest level we are looking for mistakes, irrelevancies, failures in logic, or in recognizing contradictions within the answer, explanation or critique. The presence of unnecessary language suggests, at the very least, a confused understanding of the situation.[3]
A second feature of a scientifically illiterate response is a failure to recognize the limits of scientific knowledge; this includes an explicit recognition of the tentative nature of science, combined with the fact that some things are, theoretically, unknowable scientifically. For example, is “dark matter” real or might an alternative model of gravity remove its raison d’être?[4]
When people speculate about what existed before the “big bang” or what is happening in various unobservable parts of the multiverse, have they left science for fantasy. Similarly, speculation on steps to the origin of life on Earth (including what types of organisms, or perhaps better put living or pre-living systems, existed before the “last universal common ancestor”), the presence of “consciousness” outside of organisms, or the probability of life elsewhere in the universe can be seen as transcending either what is knowable or likely to be knowable without new empirical observations.
While this can make scientific pronouncements somewhat less dramatic or engaging, respecting the limits of scientific discourse avoids doing violence to the foundations upon which the scientific enterprise is built. It is worth being explicit, universal truth is beyond the scope of the scientific enterprise.
The limitations of scientific explanations
Acknowledging the limits of scientific explanations is a marker of understanding how science actually works. As an example, while a drug may be designed to treat a particular disease, a scientifically literate person would reject the premise that any such drug would, given the nature of interactions with other molecular targets and physiological systems, be without side effects and that these side effects will vary depending upon the features (genetic, environmental, historic, physiological) of the individual taking the drug. While science knowledge reflects a social consensus, it is constrained by rules of evidence and logic (although this might appear to be anachronistic in the current post-fact age).
Even though certain ideas are well established (Laws of Conservation and Thermodynamics, and a range of evolutionary mechanisms), it is possible to imagine exceptions (and revisions). Moreover, since scientific inquiry is (outside of some physics departments) about a single common Universe, conclusions from different disciplines cannot contradict one another – such contradictions must inevitably be resolved through modification of one or the other discipline. A classic example is Lord Kelvin’s estimate of the age of the Earth (~20-50 million years) and estimates of the time required for geological and evolutionary processes to produce the observed structure of the Earth and the diversity of life (hundreds of millions to billions of years), a contradiction resolved in favor of an ancient Earth by the discovery of radioactivity.
Scientific illiteracy in the scientific community
There are also suggestions of scientific illiteracy (or perhaps better put, sloppy and/or self-serving thinking) in much of the current “click-bait” approach to the public dissemination of scientific ideas and observations. All too often, scientific practitioners, who we might expect to be as scientifically literate as possible, abandon the discipline of science to make claims that are over-arching and often self-serving (this is, after all, why peer-review is necessary).
A common example [of scientific illiteracy practiced by scientists and science communicators] is provided by studies of human disease in “model” organisms, ranging from yeasts to non-human primates. While there is no doubt that such studies have been, and continue to be critical to understanding how organisms work (and certainly deserving of public and private support) – their limitations need to be made explicit, while a mouse that displays behavioral defects (for a mouse) might well provide useful insights into the mechanisms involved in human autism, an autistic mouse may well be a scientific oxymoron.
Discouraging scientific illiteracy within the scientific community is challenging, particularly in the highly competitive, litigious,[5] and high stakes environment we currently find ourselves in.[6] How to best help our students, both within and without scientific disciplines, avoid scientific illiteracy remains unclear, but is likely to involve establishing a culture of Socratic discourse (as opposed to posturing). Understanding what a person is saying, what empirical data and assumptions it is based on, and what does it imply and or predict are necessary features of literate discourse.
Roberts, D.A., Scientific literacy/science literacy. I SK Abell & NG Lederman (Eds.). Handbook of research on science education (pp. 729-780). 2007, Mahwah, NJ: Lawrence Erlbaum.
Klymkowsky, M.W., J.D. Rentsch, E. Begovic, and M.M. Cooper, The design and transformation of Biofundamentals: a non-survey introductory evolutionary and molecular biology course. LSE Cell Biol Edu, in press., 2016. in press.
Lee, H.-S., O.L. Liu, and M.C. Linn, Validating measurement of knowledge integration in science using multiple-choice and explanation items. Applied Measurement in Education, 2011. 24(2): p. 115-136.
4. Henson, K., M.M. Cooper, and M.W. Klymkowsky, Turning randomness into meaning at the molecular level using Muller’s morphs. Biol Open, 2012. 1: p. 405-10.
[1] Assuming, of course, that what a person’s says reflects what they actually think, something that is not always the case.
[2] This is one reason why multiple-choice concept tests consistently over-estimate students’ understanding ( 3. Lee, H.-S., O.L. Liu, and M.C. Linn, Validating measurement of knowledge integration in science using multiple-choice and explanation items. Applied Measurement in Education, 2011. 24(2): p. 115-136.)
[3] We have used this kind of analysis to consider the effect of various learning activities 4. Henson, K., M.M. Cooper, and M.W. Klymkowsky, Turning randomness into meaning at the molecular level using Muller’s morphs. Biol Open, 2012. 1: p. 405-10..
Mike Klymkowsky is a Professor of Molecular, Cellular, and Developmental Biology at the University of Colorado Boulder. In the area of biology education research, he developed (with Kathy Garvin-Doxas) the NSF-supported Biological Concepts Instrument (BCI), as well as a suite of virtual laboratory activities in molecular biology with Tom Lundy. He has been involved with the general question of how to develop more rigorous, coherent, and engaging courses and curricula in the biological sciences, including a re-designed introductory evolutionary, molecular, and systems biology course – Biofundamentals and general chemistry – Chemistry, Life, the Universe & Everything (CLUE), both with Melanie Cooper (Chemistry – Michigan State University). See “About this Blog” for more on Mike’s work.
Forecasters have predicted an increased chance of a colder-than-usual start to this winter due to a change in Arctic conditions and ‘unusual’ tropical rainfall patterns.
The Met Office said the conditions mean there is a 30 per cent likelihood the mercury will plunge at the beginning of this winter – the highest risk of a cold start since the bitterly cold season of 2010/11.
But the agency said it was too early to predict whether it would be a snowy, wet or dry three-month period from November.
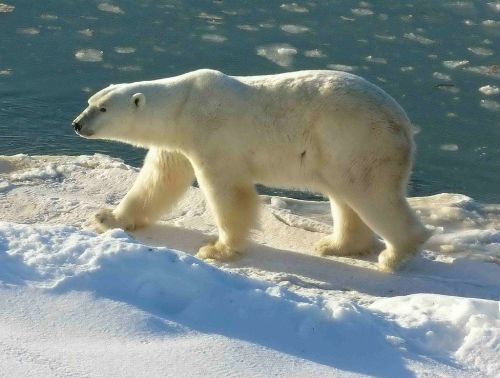
Reports from Seal River, just north of Churchill at Churchillwild, at July 26 were crowing about seeing lots of bears onshore, with a veritable beehive of activity the weekend of 16/17 July:
“This has without a doubt been Churchill Wild’s most spectacular start to the summer polar bear watching season. …Bear numbers are up spectacularly this year and all are looking very fat and healthy, perhaps much to the chagrin of climate change “experts.” Our best day for the seductive white carnivores over the past week featured 21 polar bears sighted between the Lodge and our whale swim spot! … The ice pack, which was still visible a week ago [i.e, 17 July or so], has finally dissipated and pushed a large number of bears on to our coastline here at Seal River, with the end result being many very happy cameras!” [my bold]
You can’t believe the ridiculous stuff the Alarmists and the MSM push!!
Researchers at the University of Auckland studied aerial images (pictured) of the islands from 1945 up until 2010 and found that a new island has grown from decimated remains
Those (non) disappearing Pacific Islands: Björn Lomborg, writing for the Wall Street Journal –
Once a year or so, journalists from major news outlets travel to the Marshall Islands, a remote chain of volcanic islands and coral atolls in the Pacific Ocean, to report in panicked tones that the island nation is vanishing because of climate change. Their dispatches are often filled with raw emotion and suggest that residents are fleeing atolls swiftly sinking into the sea.
The truth is
Peer-reviewed study, published in the September 2015 issue of Anthropocene, revealed that since the middle of the 20th century the total land area of the islands has actually grown.
. . . . . . .
The media and Carbon Pollution. They call it carbon pollution. This is a lie. They are actually, non-factually referring to Carbon Dioxide Pollution. Look at this story from the Alarmist Sydney Morning Herald (SMH). (There are a zillion examples like this from the Main Stream Media (MSM).
Australia emitted 549.3 mega-tonnes (Mt) of carbon dioxide in 2014-15, up 0.8 per cent on the year before but down nearly 3per cent on projections. Emissions increases were recorded in the electricity, transport, fugitive emissions and industrial and power generation sectors and offset only by a strong decline in agricultural emissions.
Is the SMH ignorant? Is it really Carbon Dioxide Pollution?
Carbon dioxide is a colorless, odourless, nontoxic gas. We exhale it. Carbon dioxide is a necessary component for photosynthesis and the growth of green vegetation. (link)
What happens when they can’t get their “dirty weather,” as Al Gore calls it? Then they’ll just have define down what a disaster is.
Eleven years ago, Gore swore that “the science is extremely clear now.” Global warming was “magnifying” the “destructive power” of the “average hurricane,” he said. Man’s impact on the environment “makes the duration, as well as the intensity of the hurricane, stronger.”
So why does the SMH use a graphic pushing a lie? The Alarmists kept saying that man made global warming would increase Hurricanes in mainland America, but the numbers have reduced to zero. What do these clowns do? Redefine Hurricanes.
These clowns, the Alarmists supported by the MSM have pushed so many false positions and, yet, they still think that they are beyond ridicule.
No. The tide has turned. The world has turned their collective backs on the man-made global warming hoax. However, it is still costing the citizens trillions.
The Polar Vortex is on the move unusually early this year, forecasters have revealed – and say it could strike the US in January.
A recent study claimed Arctic sea-ice loss is causing the Polar Vortex to shift and as a result, winters are expected to get longer and more bitter. Now, forecasters say it is ‘unprecedentedly early’.


 M.W. Klymkowsky web site: