Debunking 2023-2024 El Niño ‘Gobsmackingly Bananas’ Warming

Since January 2022, I have been repeatedly asked for my opinion on the hypothesis that suggests the Hunga Tonga event was a major factor in making the 2023 – 2024 El Nino event uniquely strong in its influence on the global average air temperature (GAT) anomaly
Many climatologists in the alarmist media spot light have gone as far as to suggest that this recent El Nino and the warming that ensued, was ‘absolutely gobsmackingly bananas’, as the warming that ensued was supposedly so extensive and rapid.
In an essay that appeared in Nature this past March, NASA’s chief climate alarmist, Gavin Schmidt said:
“It’s humbling, and a bit worrying, to admit that no year has confounded climate scientists’ predictive capabilities more than 2023 has.”
Gavin Schmidt went on further to suggest that climate models can not explain the extent and pace of warming of the global average air temperature and stated that we may in fact be entering unchartered territory.
In the other camp, other climatologists have argued that the 2023 – 2024 El Nino may have largely been due to the combined effect of Walker Circulation Dynamics and the influence of massive quantities of water vapor injected into the stratosphere via the Hunga Tonga eruption.
One such example was Jenkins et al. (2023) who estimated through modeling that this eruption could add an additional 0.035 to 0.1 C of warming to the 2023 – 2024 El Nino and that the effect would wane within 2 to 5 years.
Note, the GAT anomaly increased by approximately 0.6 C in 2023 (Figure 3).
Until now, I have refrained from giving my own opinion on this topic, because I was struggling to see clear evidence that the recent El Nino was unusual and I most definitely did not agree with the idea that we are entering a period of ‘global boiling’ as claimed by the United Nations.
Before I dive into my own analysis, I will first provide a brief overview of the unprecedented modern eruption that was Hunga Tonga.
On January 15, 2022, the world witnessed a geological spectacle as the Hunga Tonga-Hunga Ha’apai submarine volcano erupted with unprecedented force in the South Pacific, near Tonga (20°30′ S, 175°23′ W).
This wasn’t the volcano’s first act—its initial eruption in 2015 had already hinted at its potential.
As of October 2025, nearly four years later, the ripple effects of this eruption continue to challenge scientists, policymakers, and the public.
Let’s unpack this natural experiment, from its overlooked 2015 precursor to its supposed ongoing influence on our atmosphere, and ask: is there empirical data that clearly supports either a Hunga Tonga influence or that we have entered into an era of ‘global boiling’?
The Hunga Tonga eruption released the most intense lightning storm in modern history – over 2,600 bolts per minute.
The story begins in 2015, when Hunga Tonga first rumbled to life. That eruption, though significant, was a mere whisper compared to 2022’s roar which released modest amounts of sulfur dioxide (SO2), the usual volcanic culprit behind stratospheric cooling via reflective sulfate aerosols.
Scientists noted the 2015 event, but largely moved on, assuming it was a typical submarine eruption with limited global reach. Fast forward to 2022, and the volcano unleashed a paroxysmal explosion, triggered by magma-seawater interaction beneath the ocean surface.
What stunned researchers was the anomaly: despite its magnitude—equivalent to a 10-megaton TNT blast—Hunga Tonga emitted remarkably little SO2, far less than expected for such a powerful eruption.
The hypothesis?
The submarine setting allowed seawater to quench the magma rapidly, suppressing the high-temperature oxidation of magma soluble sulfide minerals that typically liberates SO2 when exposed to the atmosphere.
Instead, the eruption became a water pump, ejecting an estimated 146 million metric tonnes of water vapor into the stratosphere—ten times the amount from the 1991 Mount Pinatubo eruption and a record-breaking injection for a single event.
This massive water vapor plume, lofted to altitudes of 30-50 kilometers, has forced a reevaluation of volcanic impacts. Water vapor, doesn’t reflect sunlight like SO2-driven aerosols; it traps outgoing long wavelength radiation (OLR) or heat.
The mechanistic hypothesis centers on how this stratospheric water alters OLR.
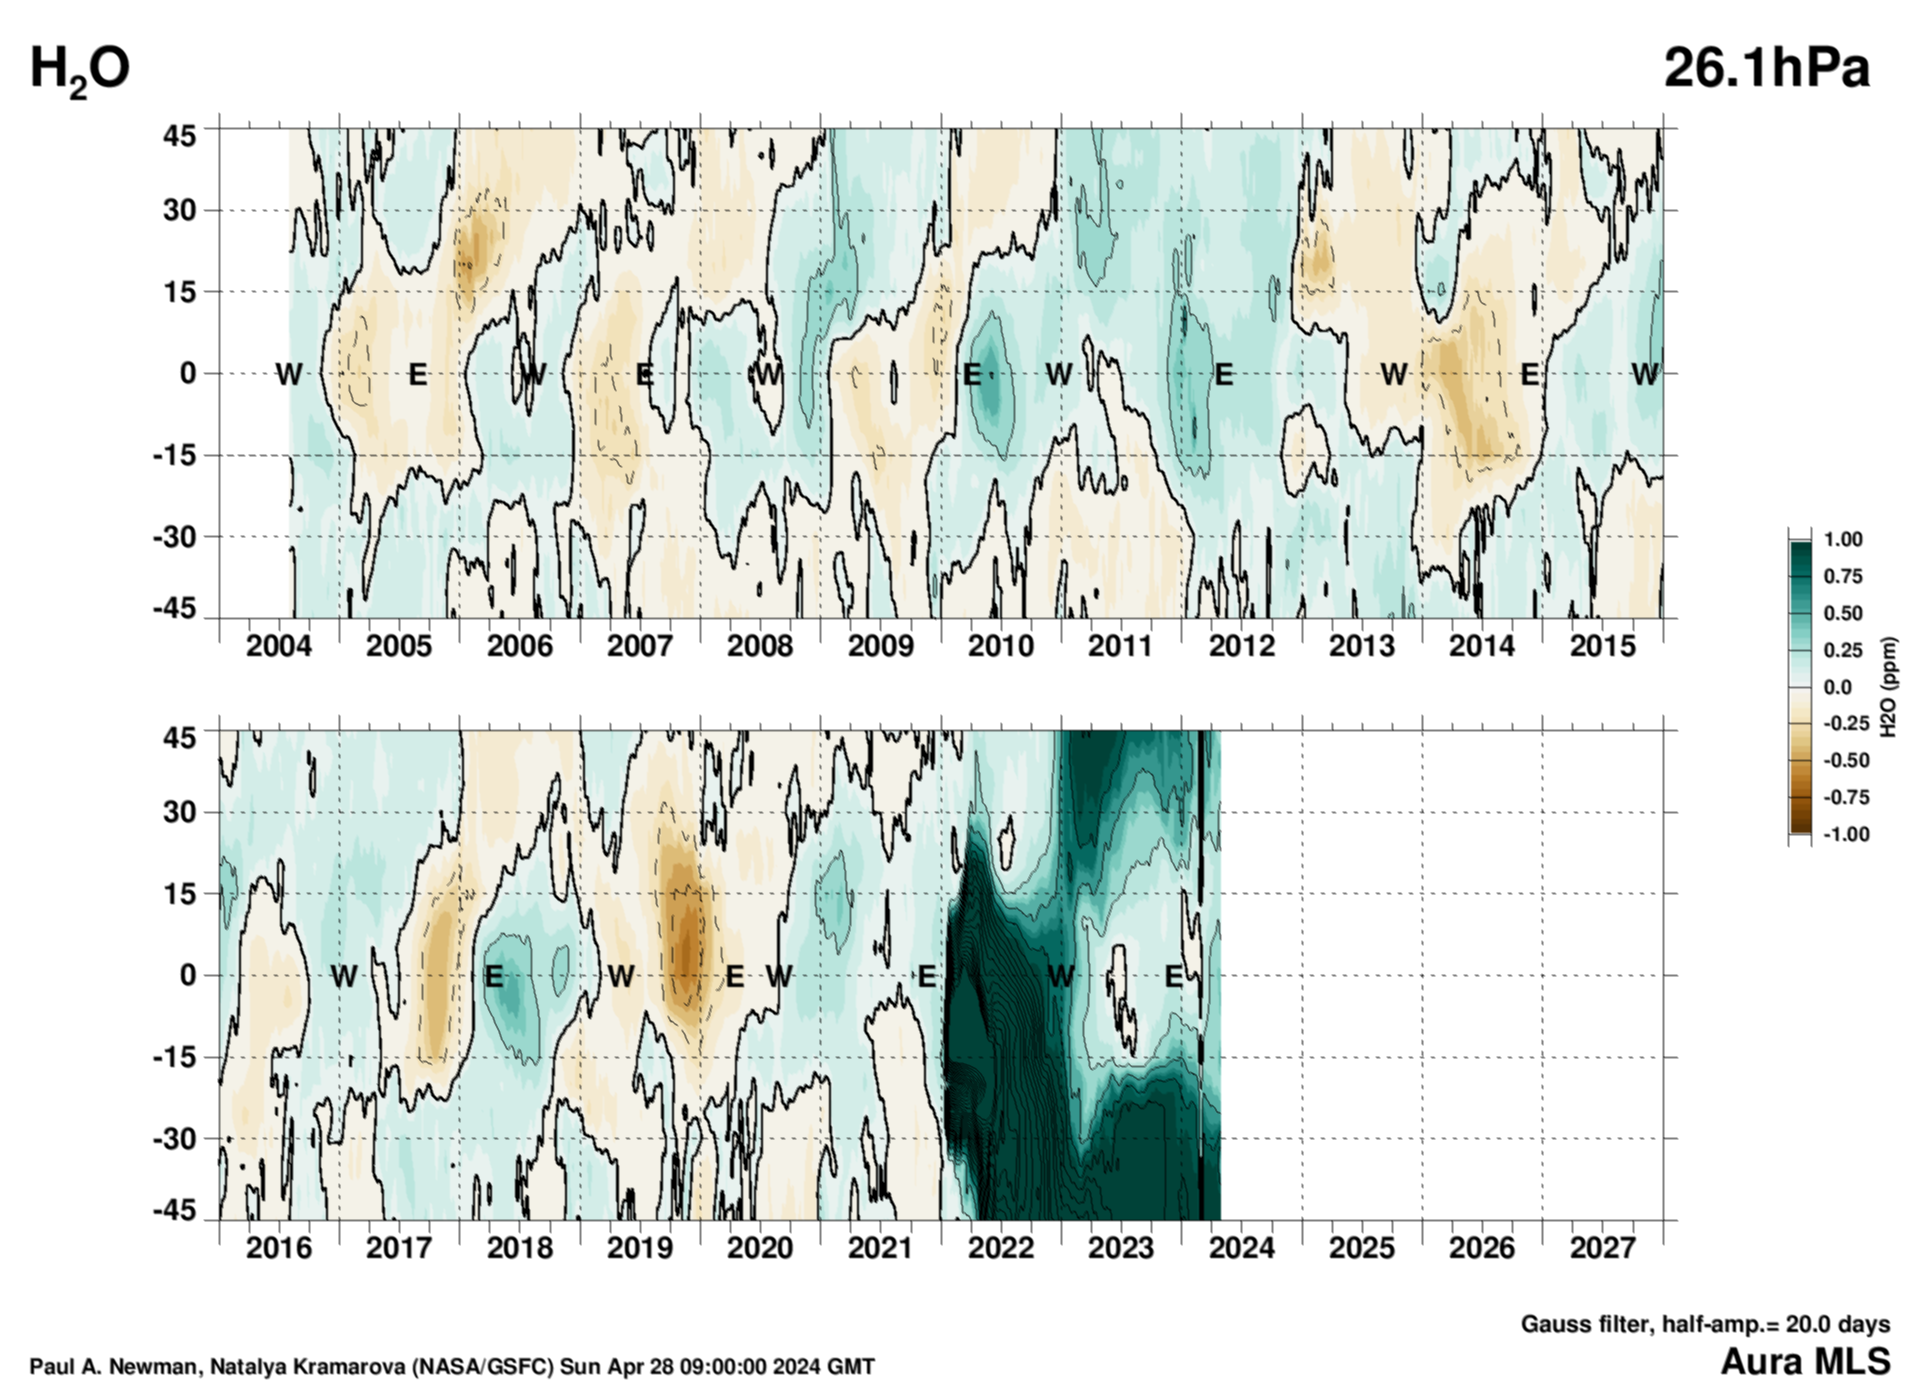
Normally, the stratosphere is dry, with water vapor concentrations varying between 3 and 5 parts per million by volume (ppmv). Hunga Tonga’s injection spiked stratospheric H2O levels a full 1 ppm above average, as shown in Figure 1, which is a H2O concentration anomaly map time series that is up to date as of October 2025.

Figure 1. Stratospheric H2O concentration anomaly map.
In Figure 1, Northern Hemisphere latitudes are positive and Southern Hemisphere latitudes are negative and 26 hPa is a pressure level corresponding to an altitude of approximately 25 km.
We also see that H2O vapor took most of 2022 to make its way into the Northern Hemisphere – the Hunga Tonga eruption was located in the South Pacific sub-tropical Ocean, its impact was immediately expressed in the Southern Hemisphere.
As 2024 progresses, we find a lingering and more uniform above average H2O content across global stratosphere, while its concentration has decreased relative to 2022 and 2023.
Note that H2O injected into the stratosphere will ultimately be pulled back down into the higher latitudes via Brewer-Dobson convective overturning circulation as illustrated in Figure 2.
As there is a large degree in uncertainty in this overturning rate, it is difficult to predict with accuracy, how long the anomalously high H2O concentration will persist in the stratosphere.

Figure 2. Stratospheric Brewer-Dobson convective overturning circulation.
Now that we have that high level introduction out of the way, it is now time to dive into the data.
First, let us start by comparing the last 30 years of satellite measurements of the global average air temperature (GAT) anomaly (green) versus the Pacific Trade Wind Speed (PTWS) anomaly as shown in Figure 3. The PTWS anomaly is a proxy for Walker Circulation dynamics, which is temporally causative of changes in the GAT anomaly, as is clear in Figure 3.
By starting with a 30 year comparison, we establish perspective.
Note the red star designating the Hunga Tonga event.

Figure 3. 30 year record of satellite measured global air temperature (GAT) anomaly versus Pacific Trade Wind Speed (PTWS) anomaly.
Likewise, note that the PTWS goes positive when the easterly velocity decelerates and that El Nino events lag the peak positive PTWS value – this is well understood to imply a causative relationship exists.
The lag represents the time it takes for the GAT anomaly to respond to changes in clouds and atmospheric circulation in the Pacific tropics to perturb the GAT anomaly.
It takes time for the tropical energy pulse to propagate globally.
As we can see in 2025, a La Nina state is rapidly emerging (i.e., PTWS is rapidly going negative) and the GAT anomaly is plummeting.
What I want you to focus on before moving onto the next data set, is how closely the GAT anomaly follows the PTWS anomaly right up until 2021, at which point there was a steep acceleration in PTWS, but the GAT anomaly failed to proportionately track into negative territory.
This is highly uncharacteristic.
This point is essential to make, especially considering that the Pacific tropics moved into an extremely rare three year consecutive La Nina condition (cooling) from late 2020 to early 2023. By the time the Hunga Tonga event occurred, the Pacific tropics were already moving into its second year of heightened Walker Circulation (i.e., higher velocity easterlies).
Arguably, a three year La Nina should have aggressively pulled the GAT anomaly towards cooler conditions.
Currently, the GAT anomaly is diving into negative territory in a much more characteristic manner, now that the 2023 – 2024 El Nino has peaked and the PTWS anomaly is trending negatively (accelerating) with the pending La Nina state expected this coming Northern Hemisphere winter season.
As I regularly tell people that the GAT anomaly does not provide geographical context, I now move onto Figure 4, which compares the air temperature anomalies over the global tropics (green), the extra-tropical Northern Hemisphere (blue) and the extra-tropical Southern Hemisphere (tan) from 2000 to present.

Figure 4. Satellite measurements of the 21st century tropospheric air temperature changes as a function of geographic zones.
Continue to focus on the red star and the zonal differences, especially between the 2020 El Nino and the 2023 – 2024 El Nino.
What is most intriguing is that while the tropical air temperatures (green) cooled over the three year La Nina condition (2020 – 2023), the extra-tropical Northern Hemisphere (tan) was uncharacteristically non-responsive relative to normal behavior following a transition from an El Nino to a La Nina in the Pacific tropics.
The response of the extra-tropical Southern Hemisphere (blue) was qualitatively consistent relative to recent El Nino to La Nina conditions over the 21st century, though it is noted that in late 2021, the extra-tropical Southern Hemisphere warmed slightly as the tropics dropped further in temperature.
Let us zoom in now to examine in closer detail these zonal changes from the minor El Nino event in 2020 to the present (June, 2025).
Figure 5 clearly shows that the recalcitrant extra-tropical Northern Hemisphere, as well as the extra-tropical Southern Hemisphere, did not begin to warm until the tropics began to revert to an El Nino state in early 2023.
Further, the tropics cooled for most of 2022, following the Hunga Tonga eruption.
These extra-tropical and tropical air temperature trends in 2022 does not support the idea that the large rise in stratospheric H2O content (Figure 1) set in motion the pieces of the puzzle required to warm the troposphere.
The lagged response of both extra-tropical hemispheres to the sudden and large warming trend in the tropics starting in early 2023 is very typical of a conventional El Nino event, which as shown in Figure 3, corresponds with a rapid deceleration of the PTWS anomaly.
Next, note the lagging transition of both extra-tropical hemispheres relative to the global tropical air temperature, in early 2025, as all three zones revert to a rapid cooling trend.
Again, the lag is indicative of the time it takes for excess energy growth or decline in the Pacific tropics, and the distance atmospheric – oceanic circulation must travel to reach the extra-tropical latitudes.

Figure 5. Satellite measurements of tropospheric air temperature changes as a function of geographic zones since 2020.
Now let us change channels by moving onto satellite data specific to global average changes in reflected short wavelength (aka solar radiation) and outgoing long wavelength (OLR) radiation (aka heat).
Please see Nino Excess Energy: Decoding the Pacific’s Role in Global Climate Shifts to revisit how I use CERES satellite data to convert reflected short wavelength radiation data into a measure of absorbed short wavelength radiation (ASR).
ASR is in essence absorbed sunshine.
As I have discussed in a recent article titled YOUR CO2 EMISSIONS ARE NOT DRIVING CLIMATE CHANGE BY TRAPPING HEAT, changes in OLR relative to the top of the Earth’s atmosphere are strongly influenced by changes in the distribution of different cloud types (e.g., marine stratiform, cirrus), also alters ASR intensity.
The reason being is that on average, clouds represent a true greenhouse effect and thus trap tropospheric heat and block OLR.
Therefore, we can not examine OLR for evidence of a Hunga Tonga finger print, without including corresponding ASR data.
Figure 6 shows the change in ASR and OLR from 2018 to present, together with the Hunga Tonga event – relative to 2000.

Figure 6. CERES satellite data specific to changes in absorbed short wave (ASR) and outgoing long (OLR) radiation – relative to 2000.
Note how changes in ASR leads changes in OLR, which of course implies that absorbing sunshine releases heat and ultimately becomes OLR once that heat rises to the top of the atmosphere.
As well, note that ASR is consistently higher than OLR, which means more energy is being stored in the surface environment than is escaping back to space. The difference between changes in ASR and OLR, is equivalent to a growing force, like a coiled spring, which ultimately will be expressed as changes in temperature, the hydrosphere and convective overturning of the oceans and atmosphere.
Likewise, see how in both early 2018 and mid-2022, changes in ASR begins to track towards higher values, OLR takes months to follow.
See the temporal progression of the global average change in ASR and OLR relative to the Hunga Tonga event.
Finally, when we compare the difference between changes in ASR and OLR versus the PTWS anomaly (Figure 7), we see a remarkably complex relationship that strongly suggests that these physical parameters are consistently linked to changes in Walker Circulation in the Pacific tropics.
We should not expect a perfect match, as the difference in changes in ASR & OLR is a global average value, while PTWS is specific to a narrow path (5N – 5S) along the Pacific (240W – 90W) equator.
In other words, a region that represents merely 3.6 percent of the Earth’s surface, appears to be first order in its influence on global changes in air temperature and radiation balance.

Figure 7. Pacific Trade Wind Speed (PTWS) anomaly and the difference in global ASR and OLR time series (CERES data).
A closer inspection of these same parameters over the time span of 2018 to present, shines a brighter light on the potential role of the Hunga Tonga event on Walker Circulation in the Pacific tropics and changes in the Earth’s energy balance (Figure 8).
Figure 8 shows that there is no increase in driving force (i.e., difference in ASR & OLR) for climatic change (e.g., air temperature) over all of 2022 and that the eruption failed to alter the pace of near-by Walker circulation (i.e., PTWS anomaly).

Figure 8. Pacific Trade Wind Speed (PTWS) anomaly and the difference in global ASR and OLR time series (CERES data).
True, the PTWS did not lead the growth in the difference in global changes in ASR & OLR values in early 2023 on the rapid lead up to the 2023 – 2024 El Nino, but neither did the PTWS anomaly lead during the 2010 – 2011 El Nino (Figure 7).
Only during the 2017 and 2020 El Ninos does the difference in global ASR & OLR appear to change in what appears to be an almost phase locked temporal relationship with the PTWS anomaly.
It is worth mentioning that not all El Ninos are the same.
While the 2010 – 2011 and 2023 – 2024 El Ninos were heavily localized in the eastern tropics, the 2016 and 2020 El Ninos were largely constrained to the central tropics – the latter are commonly called El Nino Modoki events.
Modoki is a Japanese word meaning similar, but different – what these differences and similarities are will not be covered in this article (big sigh of relief).
The key take away messages here are:
- The GAT anomaly remained uncharacteristically high throughout 2021 and 2022, in spite of the fact the Pacific tropics entered a deep – extended La Nina state and that this was in large part due to the resistance of the extra-tropical Northern Hemisphere to track negatively with accelerating Pacific trade winds and enhanced Walker Circulation.
- There was no measured increase in zonal air temperatures during 2022, following the Hunga Tonga eruption and in fact, the tropical troposphere cooled.
- Both extra-tropical hemispheres did not begin to warm until the emergence of a strong eastern Pacific El Nino in early 2023 or cool until the tropics began to in a highly characteristic pattern typical to an intense eastern Pacific El Nino – La Nina transition.
- The difference in the change in global ASR & OLR over 2022 never increased and only upon the emergence of an eastern Pacific El Nino in early 2023 did this climate forcing increase.
Overall, I argue that not only is there very little supporting evidence the idea of a significant Hunga Tonga influence on the 2023 – 2024 El Nino, but furthermore, it is now becoming clear that this eastern Pacific warming event hardly supports the United Nation’s claim that we have now entered a new ‘era of global boiling’.
The rapid cooling seen in the GAT anomaly (Figure 3) to date in 2025 shows us a new era has not emerged.
Likewise, this analysis shows us that the recalcitrant 2021 – 2022 extra-tropical Northern Hemisphere (Figure 4) air temperature anomaly was, for some yet unknown reason, resistant to cooling caused by a concurrent three year La Nina state throughout the Pacific tropics.
It was this persistent warmth in the extra-tropical Northern Hemisphere that made the 2023 – 2024 eastern Pacific El Nino appear exceptional.
I will pay close attention to the progress of zonal air temperatures as we advance into the 2025 – 2026 La Nina season for signs of a point of departure of the recalcitrant extra-tropical Northern Hemisphere air temperature anomaly.
If this behavior persists, it may be an artifact of the United Nation’s IMO 2020 regulation banning of sulfur rich bunker fuel oil in maritime global shipping in 2020 and its known influence on increasing ASR along major shipping routes.
This will be a topic of a future article.
See more here substack.com
Please Donate Below To Support Our Ongoing Work To Defend The Scientific Method
PRINCIPIA SCIENTIFIC INTERNATIONAL, legally registered in the UK as a company ![]() incorporated for charitable purposes. Head Office: 27 Old Gloucester Street, London WC1N 3AX.
incorporated for charitable purposes. Head Office: 27 Old Gloucester Street, London WC1N 3AX.